
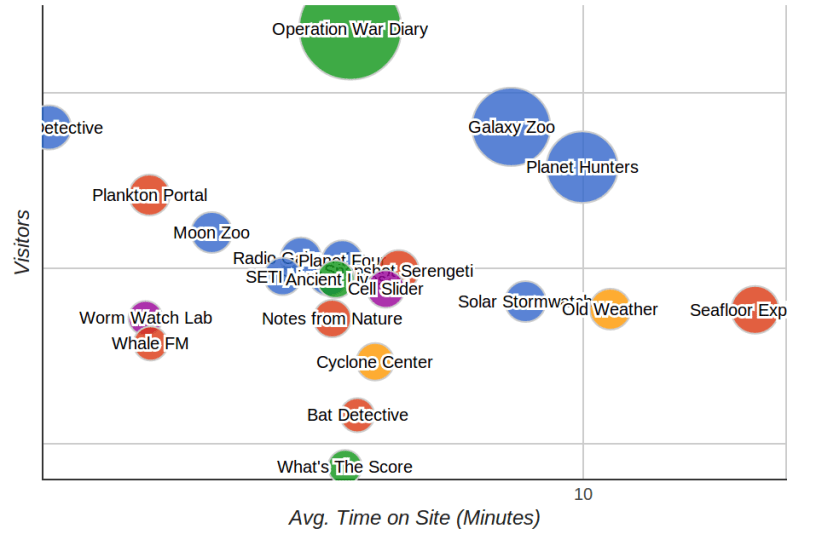
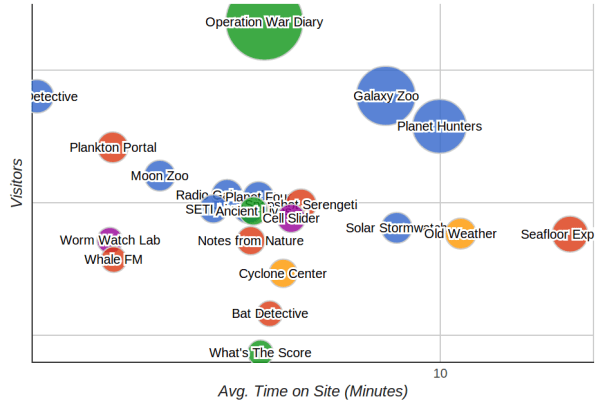
Yesterday I showed you where all our visits came from across the globe since the start of 2014. Today it’s time to show you where all those visitors to our projects spent their time. This graph shows the number of visitors versus the average time spent on the site by each visitor across all of our live projects since the start of the year.
All of these projects need your help irrespective of their place on the graph! Get involved in them right now at www.zooniverse.org

Comments are closed.