
This guest blog is by Justin Schell, who directs the Shapiro Design Lab at the University of Michigan Library and also co-hosts SciStarter’s podcast, Citizen Science. Justin is the project manager for Unearthing Michigan Ecological Data, a project that uses the Zooniverse crowdsourcing platform to identify data within a large collection of papers written by students at the University of Michigan Biological Station.
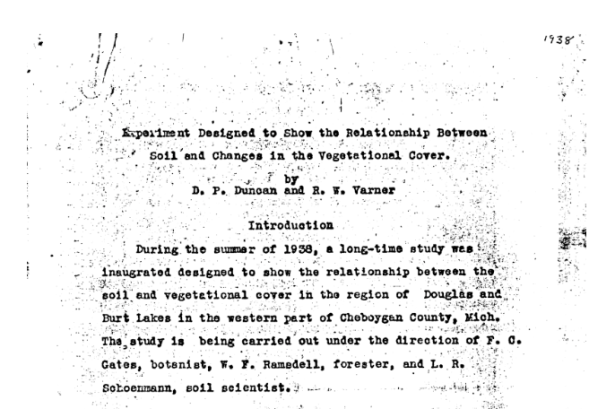
The University of Michigan Biological Station, located just south of the Mackinac Bridge in the far north of Michigan’s Lower Peninsula, is a field station founded in 1909. Field stations are outdoor laboratories that can be found throughout the world and in a variety of environments. Following extensive industrial logging and fires in the area during the 19th and early 20th centuries, researchers have studied the effects of these disturbances on the environment there. (Part of the Biological Station is on land previously held by the Burt Lake Band of Native Americans. For more on the history of this area, see the Station’s website for information and a fuller land acknowledgement.)
The Station has since evolved into a year-round, long-term research and learning community. Each spring and summer, researchers, students, and faculty live full-time at the Biological Station to research, learn, and teach about the ecosystems of the area. They form a vibrant living-learning community engaging with biology, ecology, and the study of environmental change.
Since the Station’s founding, students from around the world have published more than 4,000 papers featuring research they did at the Station. With such a long timespan of coverage and rich content, the papers contain immensely valuable data about the history of the region. However, since many of the papers are handwritten or in otherwise inaccessible formats, not much else is known about them except very basic information like the author(s), title, and year. University of Michigan librarians and Biological Station staff and faculty partnered to build a citizen science project on Zooniverse to help identify this data. Read on to learn more about the inspirations for this project, Zooniverse project building, interesting data discoveries and results, and how volunteers helped complete the first stage of the project!
Finding Inspiration
The inspirations for Unearthing Michigan Ecological Data came from multiple directions. First were Zooniverse projects focused on uncovering and recovering scientific information from archives and museums, including Old Weather, Weather Rescue, Mapping Change, and Notes From Nature, just to name a few. Secondly, I took inspiration from my experience helping to develop Michigan ZoomIN, an animal classification project on Zooniverse and led by Dr. Nyeema Harris, professor of Ecology and Evolutionary Biology at the University of Michigan. To date, Michigan ZoomIN volunteers have contributed more than a million classifications over three seasons of photographs.
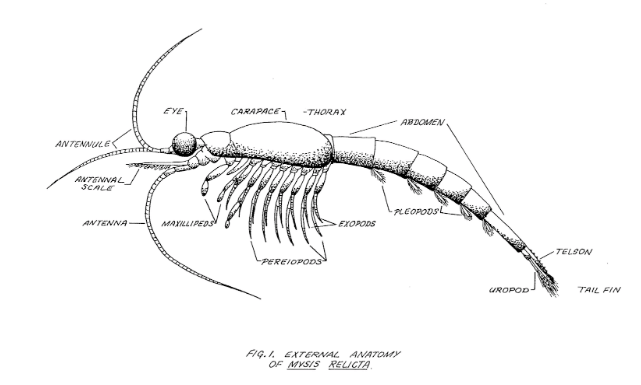
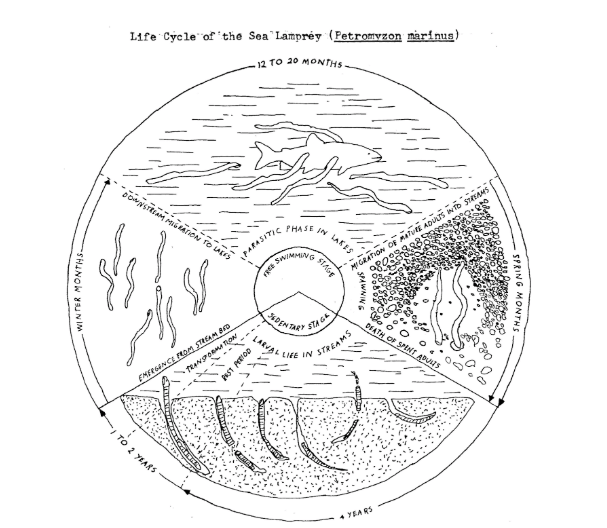
Given the success of Michigan ZoomIN, we began working with members of the Library and the broader campus community to develop additional Zooniverse projects. In 2017, Jason Tallant, the Station’s Data Manager, suggested that we develop a project based on the Biological Station’s student papers. Totalling more than 70,000 individual pages, these papers focus on a broad range of ecological topics, including birds, reptiles, fish, fungi, zooplankton, plants, trees, water quality, and much more. In fact, a direct inspiration for this project came from an ongoing research project that began with a student paper written at the Biological Station from 1938; research described in that paper has since evolved into a long-term, National Science Foundation-funded project examining how forests accumulate carbon. Jason knew that there were other potential research projects buried within these papers, as well as data that could be incorporated into long-term ecological research.
Digitizing papers
One of the biggest hurdles for Zooniverse projects like these is the need to have all the documents scanned. Fortunately, these papers had already been scanned in 2006 and 2007 as part of an effort to preserve this valuable yet vulnerable collection of unique work. Members of both the Station–including Jason and former resident biologist Bob Vande Kopple–and the University of Michigan Library–including Scott Martin, the Biological Sciences Librarian, and Jim Ottaviani, the Coordinator of Deep Blue, the digital repository for the University of Michigan–collaborated to scan the documents and create basic metadata (meaning information about the papers, such as author, title, and date) that could go along with each paper in Deep Blue.
However, little else was known about the contents of these papers (beyond this basic information) and what kind of value they might have for researchers today. Unearthing Michigan Ecological Data, then, is not only about supplementing the already-existing metadata in Deep Blue to help scholars see what data papers may contain. It is also about expanding the possibility for what this trove of research could contribute to wildlife preservation, climate adaptation, species ecology, and much more through data reuse and future studies.

Building the project
With the idea in mind and the expertise of our team, we used the Zooniverse Project Builder to create Unearthing Michigan Ecological Data in the summer and fall of 2018. Developing our project involved work on two fronts: first, creating, hosting, and uploading the images for the project, and second, developing the workflow of tasks that volunteers would complete.
This gets a bit into the weeds, but the first step to creating the Zooniverse project was making individual JPG images of each page from the scanned PDFs of the papers (the Project Builder supports a number of file types including JPG and PNG, but not PDF), which we accomplished using the Ghostscript software package. We uploaded them to an Amazon s3 server, and then created unique URLs for each page based on this location. With these URLs, we could create manifest files, which are spreadsheets with unique filenames and URLs that in turn generated multiple subject sets within the Project Builder. We then associated those subject sets with specific workflows, or collections of tasks that volunteers would complete.
As for developing the workflow of tasks that volunteers complete, we initially decided to focus on a single task: identifying the type(s) of data a page might contain. We worked with researchers at the Biological Station to identify the most common types of data that they imagine would occur in these papers, as well as what would be most useful in current and future research projects. After iterating through a number of prototypes, the final workflow involved asking volunteers to identify whether the following options were present on a page image:
- Map
- Graph
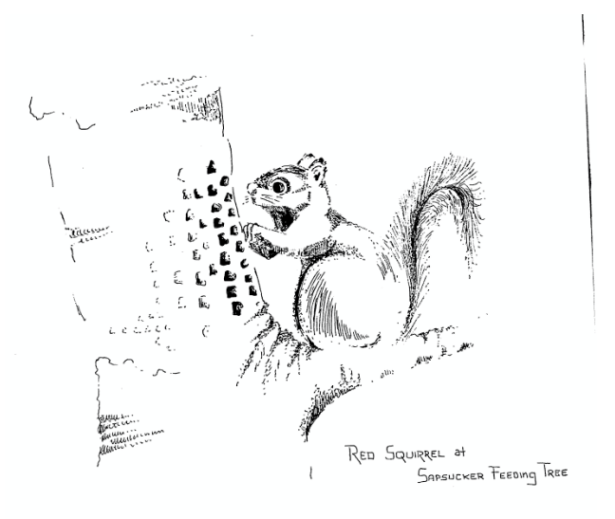
- Diagram or Illustration
- Table of numbers
- Species listed or named
- No data
- Other
Moreover, to ensure accuracy, we have multiple unique volunteers classify each image and then aggregate that data (using aggregation code provided by Zooniverse) in order to get the specific results of these classifications.
Using Optical Character Recognition (OCR)
One of the most frequently-asked questions about this project (and many other projects in this vein, for that matter) is, “Can’t a computer do this?” The answer: “Sort of, but not very well.” Several factors go into the “not very well” part of that answer. While the papers were run through an optical character recognition (OCR) engine when they were first digitized in 2006 and 2007, a large number of the papers were handwritten papers, which OCR generally does not handle well. Furthermore, the copies scanned were often photocopies of an original document (sometimes multiple generations of photocopies removed from the original), resulting in degraded and illegible printing, even for those that were created on a typewriter or word processor. Finally, since we were looking for things other than text (maps, graphs, illustrations, etc) the OCR data we had for the papers wasn’t all that applicable. Given these different aspects of the project, as well as the challenges presented to us by the pages themselves, OCR would not have been an effective way to gather this information.
As we move closer to the present day, papers are now both created and submitted digitally, meaning there is no print copy to scan, and OCR will be more accurate. We’ve chosen not to put these born-digital papers into the Zooniverse project, since we can search these papers much more easily and with greater accuracy than the earlier papers.
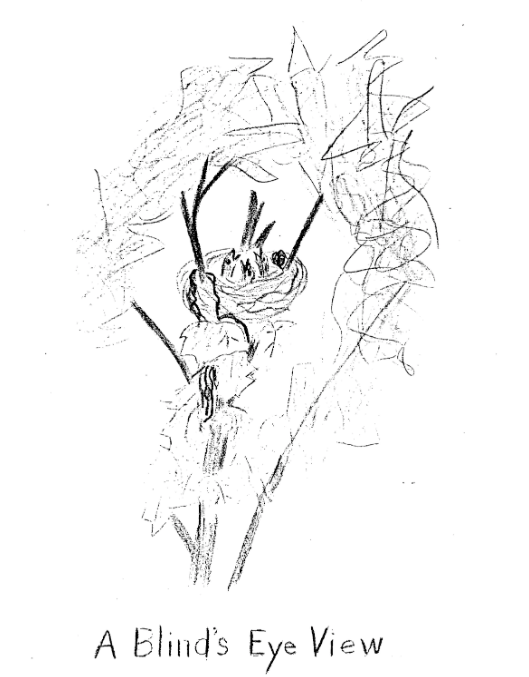
Image Credit: Hazel McKibbin.
Launching the project
After doing some local user testing among Library and Biological Station staff, we submitted the project for official review and beta testing by Zooniverse volunteers, the first step towards becoming an “official” Zooniverse project (which includes being listed on the Zooniverse home page and in an email announcement to the Zooniverse mailing list). We were excited to officially launch the project in February of 2019.
One of the benefits of using the Zooniverse Project Builder is that every project has a built-in discussion board. Volunteers can use this space to ask questions, comment on, or provide further info about a specific image. To date, volunteers have written more than 600 comments in the project’s Talk section. Some of these are identifying scanning errors (page upside down, illegible papers, and the like), and some are asking clarifying questions about images (such as whether a specific feature counts as data according to the categories we listed).

Gathering Data
Thanks to the assistance of more than 1,800 Zooniverse volunteers, the project was completed at the end of 2019 with more than 320,000 classifications. (Even though there are only 70,000 pages, each page needs to be classified multiple times by unique volunteers to ensure accuracy, as mentioned earlier.) Volunteers have found a great amount and variety of data within these papers. In terms of numbers of each kind of data, volunteers found the following:
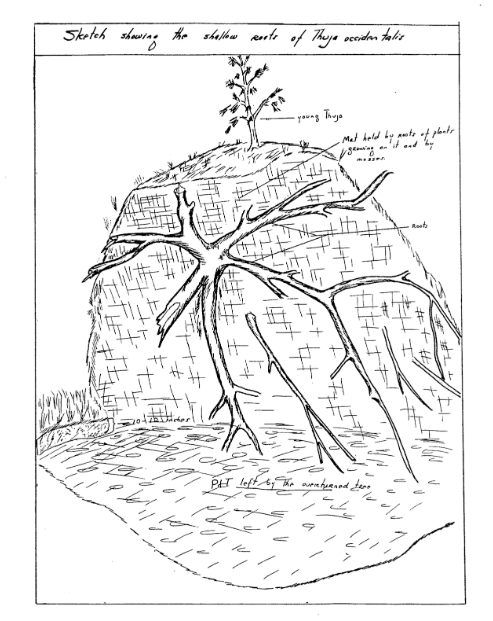
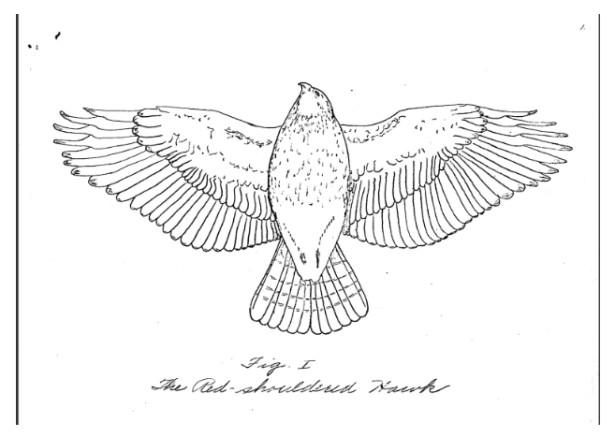
- More than 2,000 diagrams and illustrations
- More than 7,900 tables of numbers
- More than 3,900 maps
- More than 7,500 graphs
- More than 700 photographs
Sharing the data
The first step toward actually using this data will be to supplement the records of individual papers within Deep Blue. Working with our Research Data Services team in the Library, we will identify which papers have which kinds of material (specifically, diagrams and illustrations, tables of numbers, photos, maps, and graphs) and then note which of those they contain in the appropriate paper’s record online. As a result of the project, we updated more than 3200 out of 4000 records (or more than 80% of the records archived in Deep Blue). This will allow researchers to get more information about a paper or papers than they could now. As an example, records for more than 1200 individual papers will now indicate that they contain a diagram or illustration, more than 1500 will indicate that they contain a map, and more than 2200 will indicate they contain a graph.
Exploring next steps
Upon completing this first stage of the project, we can then focus on planning our next steps. We have a few ideas for how we can build upon this data. One idea is more closely examining the papers that contain tables of numbers and have Zooniverse volunteers transcribe those tables. We could then explore how those data could be integrated into specific long-term datasets or used to create new datasets related to ecological, biological, or environmental research of the area.
One possible research topic among many would be a greater historical understanding of toxic algae blooms, seeing whether certain toxic strains were present earlier than previously known. More broadly, the various forms of weather data contained within these papers could contribute to more locally-relevant climate models (as most large-scale climate models aren’t as strong when it comes to smaller geographic areas.) Finally, another possible path is to look at papers that have mentions of different species and to formulate occurrence records. These occurrence records contain a species observation, a location where the species was observed, and the time the species was observed. This process will include cross-referencing papers where volunteers identified species with a geographic database initially created by Bob Vande Kopple. These records could then be integrated into the Global Biodiversity Information Facility (GBIF), which contains more than a billion records of biodiversity from around the world.
These are just a few of many possible projects that could come about with a better understanding of the data contained within the student papers from the Biological Station. None of this would be possible, however, without all of the work of the staff at the Biological Station, the University of Michigan Library, and the many Zooniverse volunteers who have generously offered their time and knowledge in helping us better understand this wealth of data.
